23 Amazing Statistics on Internet and Social Media in 2026
Reading time: 7 min
First published: Jan 1, 2019
Updated 4 times since publishing

This year has been an explosive one for the social media world. With all of the online regulations, Twitter hashtag revolutions, and Facebook privacy scandals, the internet has offered a plethora of drama.
But even so, users are not slowing down on their internet use, with many of us spending a large portion of our day on the internet, connecting with friends, family, and the world at large.
Read on to learn about our similarities and differences, and see how we engage with the ever expanding, ever more dynamic world wide web. Editor’s Note: We value our relationship with our readers, and we strive to earn your trust through transparency and integrity. We are in the same ownership group as some of the industry-leading products reviewed on this site: ExpressVPN, CyberGhost, Private Internet Access, and Intego. That said, our detailed reviews follow a strict methodology that examines all relevant performance factors to help you arrive at your own informed conclusion.
Trends in Internet Use
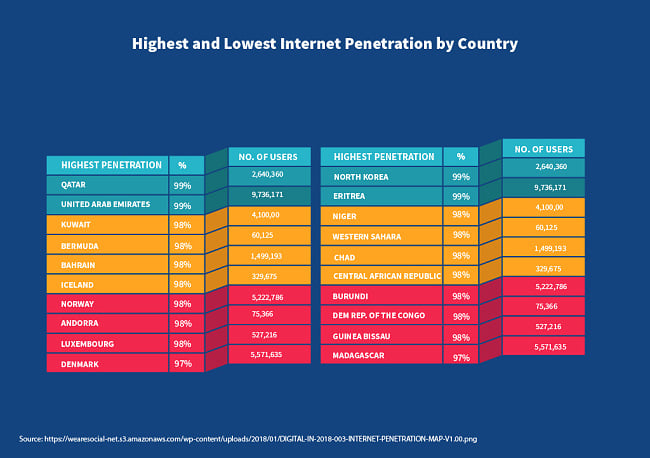
1. The GDP of countries appears to strongly correlate with internet penetration, with the wealthiest countries having higher internet penetration and vice versa. The difference between internet users in North Korea and Qatar is 98.4%
Despite its size and population, North Korea has an internet penetration of just 0.06%, while Qatar and the United Arab Emirates have a massive 99% of its citizens connected.
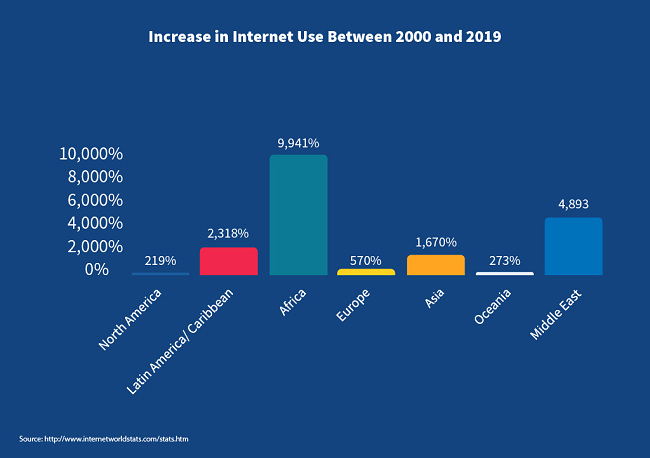
2. In the past 18 years, Africa has seen a remarkable increase of almost 10,000%, while North America has had a minute 219% increase primarily due to early adoption.
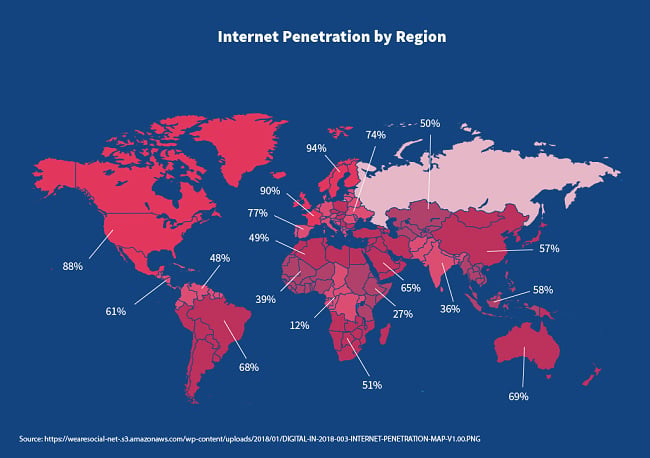
3. Internet use is most widespread in North America as well as Northern and Western Europe with over 90% penetration, while remaining low in Central and Eastern Africa with less than 20%.
This is mainly due to less infrastructure availability.
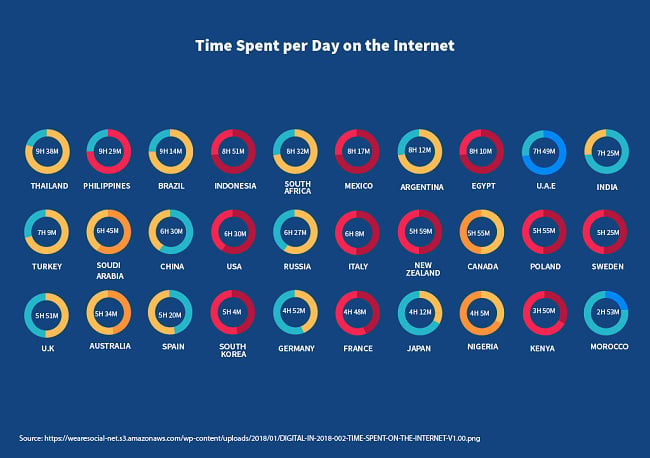
4. People in Thailand spend more time online per day than anywhere else is the world. They average out to 9 hours 38 minutes spent online every day, while the average American spends a far more modest 6 hours 30 minutes surfing the web.
However, it is no surprise that Kenya and Morocco spend less than 4 and 3 hours online per day respectively.
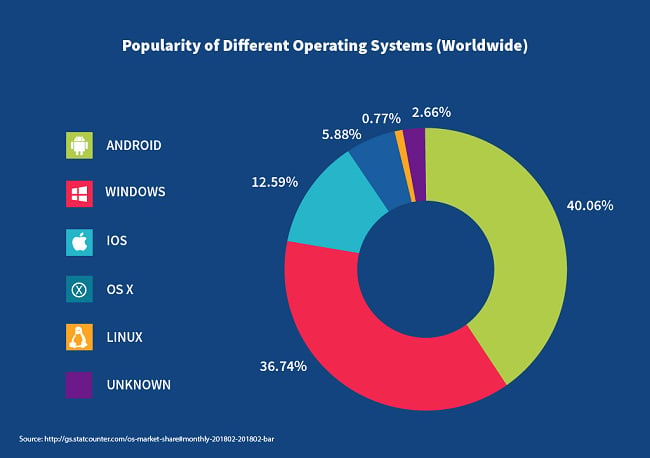
5. What is the most popular OS in the world? The high cost of Apple devices has rendered them a less common choice of OS, with a combined 18.47% total between Mac OS X and iOS. However, Android is dominating with 40.06% followed closely by Windows with 36.74%.
Linux is used with the least frequency, likely because the fact that it’s open source means it’s constantly changing, making it challenging to use if you don’t have technical know-how.
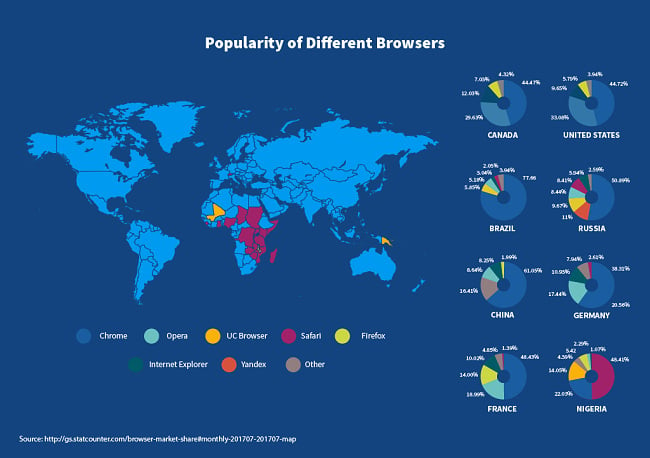
6. When it comes to browsers, you can see that Chrome beats out all other browsers by a mile.
The popularity of Opera on the poorest continent is likely due to the fact that Opera requires less data than Chrome and is therefore a better option if you don’t have the latest device or biggest data package.
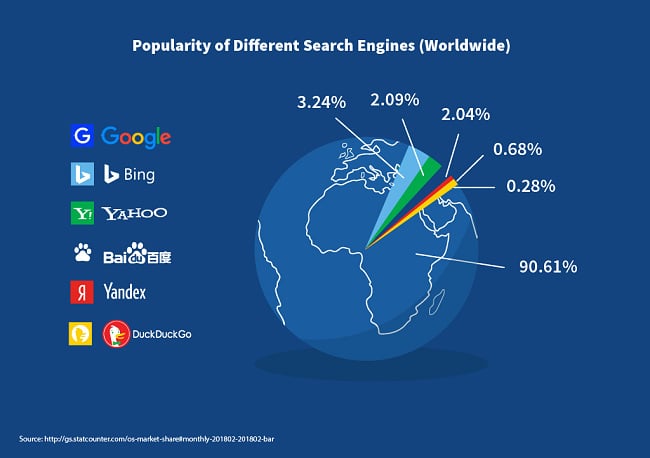
7. With 90.61% of users choosing Google as their search engine of choice, it is no wonder the phrase “Google it” has become so famous.
The main reasons for Google’s widespread use includes relevant ads and fast results. Plus, Google comes pre-installed on Android devices, the most popular operating system.
Trends in Social Media
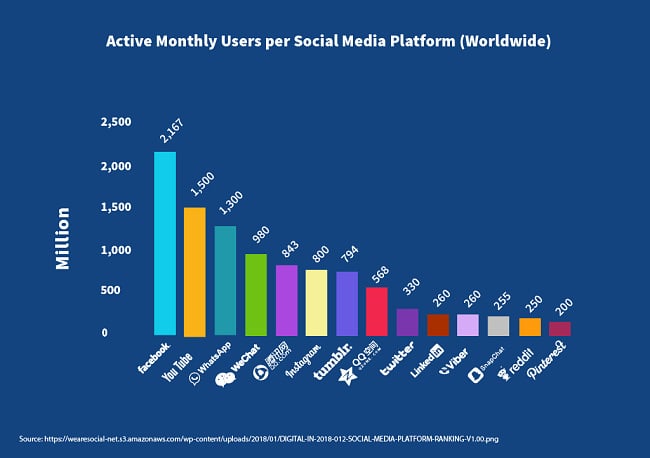
8. Facebook is still the most popular social media platform across the board, with more than 1 billion people actively using the social media site.
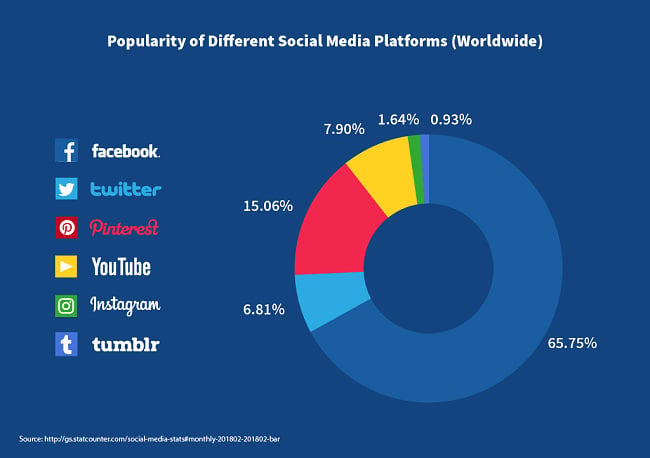
9. Facebook has over 2 billion monthly users, of which more than 1 billion access the site very regularly. YouTube has just over 1.5 billion users accessing content, making it the second most popular platform.
Pinterest brings up the rear with just 200 million monthly users
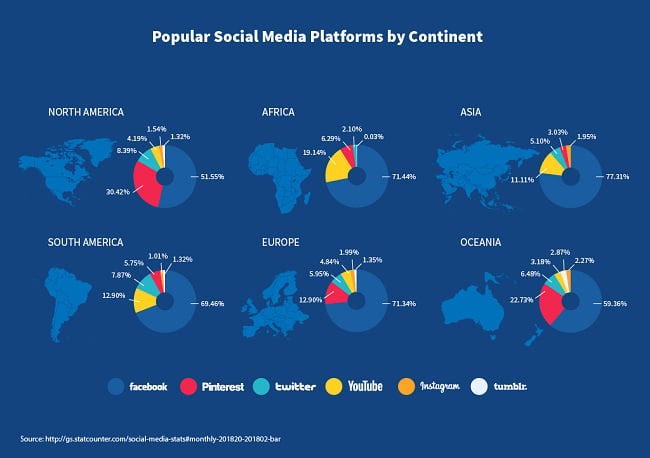
10. Although Facebook is the most popular social media platform on every continent, it faces the stiffest competition in North America, where Pinterest has a claimed a large 30.42% of users.
This is likely because of recent scandals involving user privacy which have been more widely reported in the US than in other parts of the world.
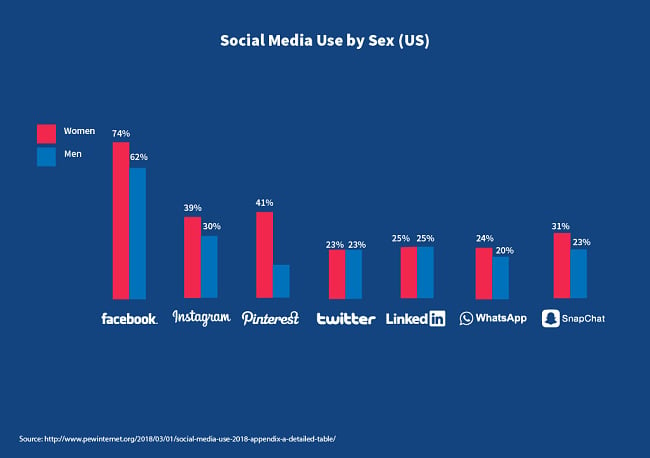
11. While most social media platforms are used roughly equally by men and women, the ones with the biggest differences always show a higher usage by women. These differences can be seen mainly with Pinterest, where there is a massive 25% difference, which one study shows is used by women more as a motivational or inspirational tool, and by men more as a bookmarking tool.
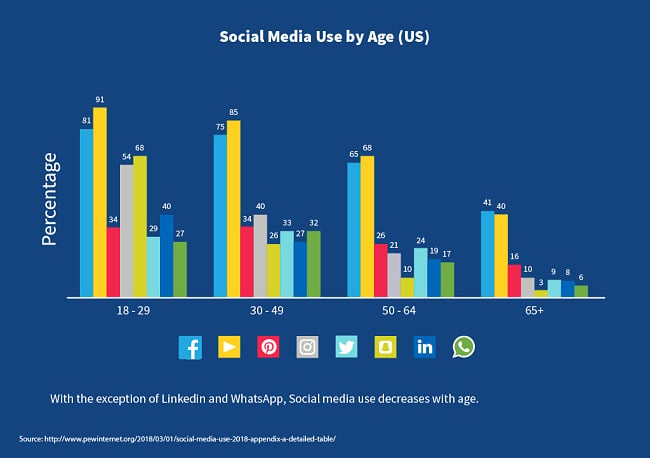
12. In general, the use of social media platforms decreases with age. However, LinkedIn and WhatsApp increase in the 30-49 year old range by around 5%.
LinkedIn is popular with this group is because it’s a professional networking site, and 30-49 year olds are at the stage where career development is most critical. On the other hand, WhatsApp-use in this age group likely has less to do with their love of the app and more to do with the convenience.
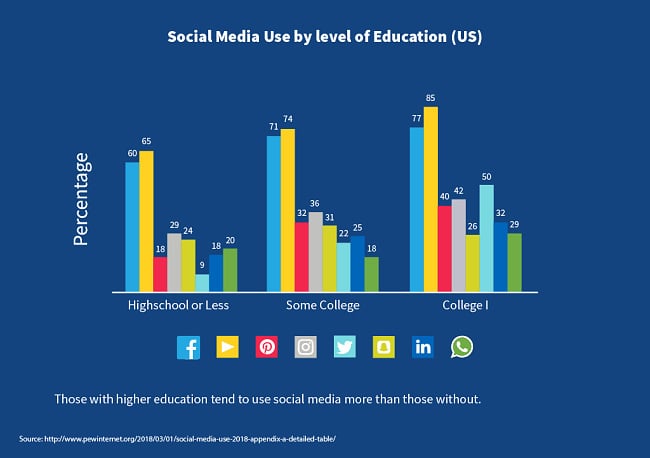
13. The more educated the person, the more they tend to use social media. While there is no obvious reason for this, it may due to more educated people having jobs that involve computers, networking, or marketing. People with a college degree use social media 10% more on average that those with some college, and around 20% more than those with high school diplomas or only some high school.
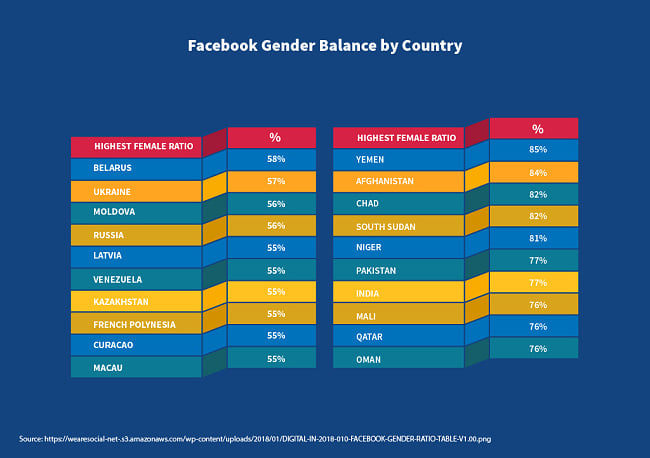
14. The countries in which Facebook use is most dominated by men are those that are patriarchal and in which gender separation is the norm, such as Yemen (85%) and Afghanistan (84%).
In fact, in the countries with male-dominated social media, women are often discriminated against sexually, physically, and educationally (many women can’t read or write).
Trends in Messenger Apps
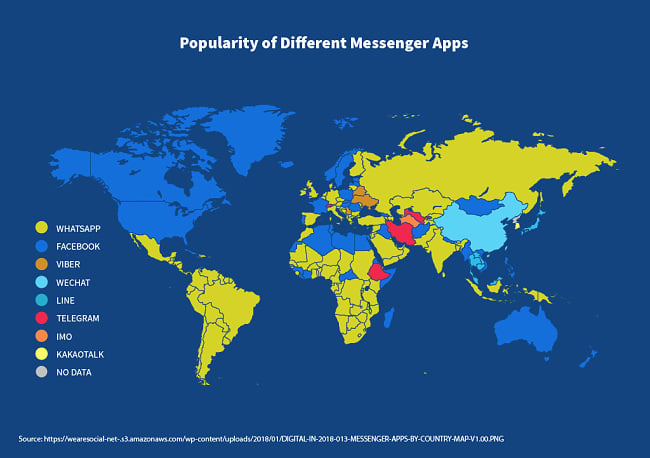
15. Facebook and WhatsApp are the most commonly used messenger apps, and are both owned by social media giant Facebook.
Notably, in China, where both Facebook and WhatsApp are blocked by the government, the Chinese-owned WeChat dominates. Similarly, the Japanese favor the Japan-based Line, and South Koreans favor the Korea-based KakaoTalk.
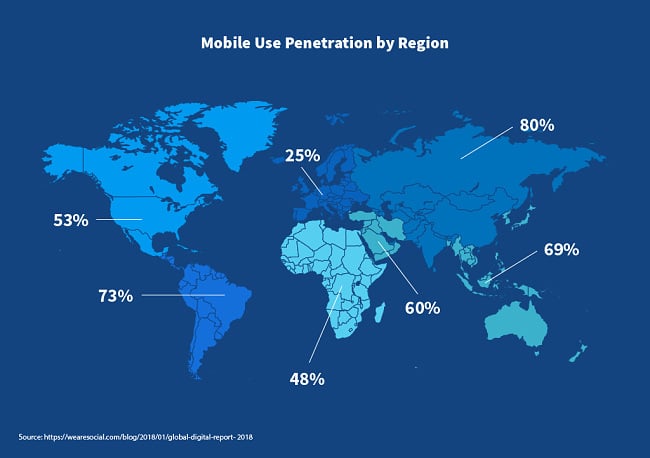
Trends in Device Use
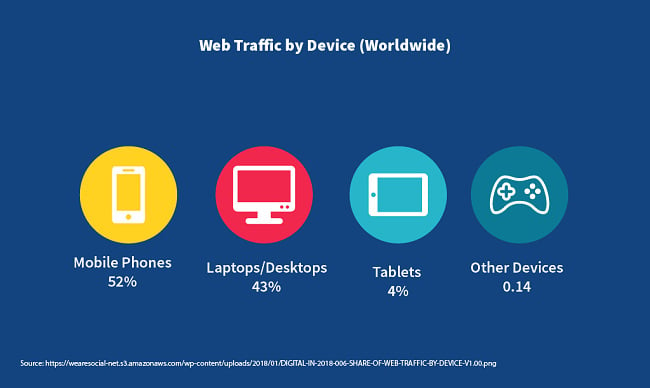
16. 52% of web surfing happens on mobile phones, which shouldn’t come a surprise. What is surprising is that while 25% of all online users use a VPN to connect to the internet, they still prefer to connect with a desktop or laptop (43%) instead of a tablet (4%).
The reasons for using a VPN can vary from bypassing online censorship to accessing geo-blocked content as well as security reasons, which is why it makes sense that ExpressVPN and NordVPN are the two most popular VPNs in the world. These two secure providers consistently bypass VPN blocks and online censorship for users, regardless if they are using a smartphone, laptop, desktop, tablet, or another device.
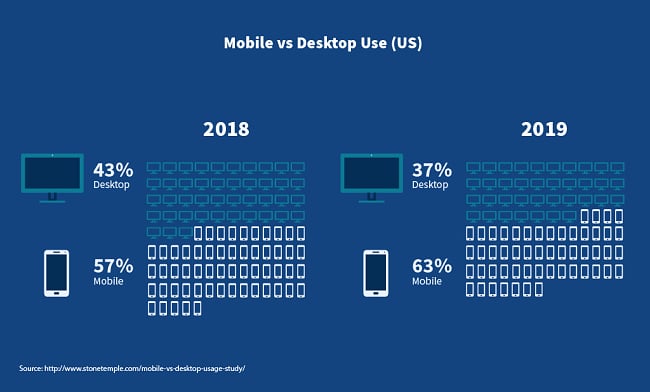
17. The internet was already being used on more mobile devices than desktops in 2018 – a trend that became even more pronounced in 2019 when a further 6% of people switch to mobile devices. This trend is likely to continue in the coming years as mobile phones are being designed with more capabilities and features than ever before.
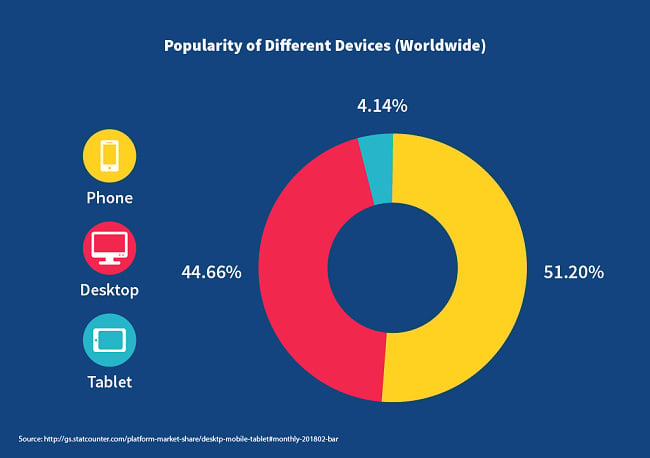
18. 51.2% of people spend time on their mobile devices rather than on their desktops (44.66%).
From tracking our fitness routines, to finding the quickest route for our commutes, to selling that old couch, there’s an app for basically every element of modern life.
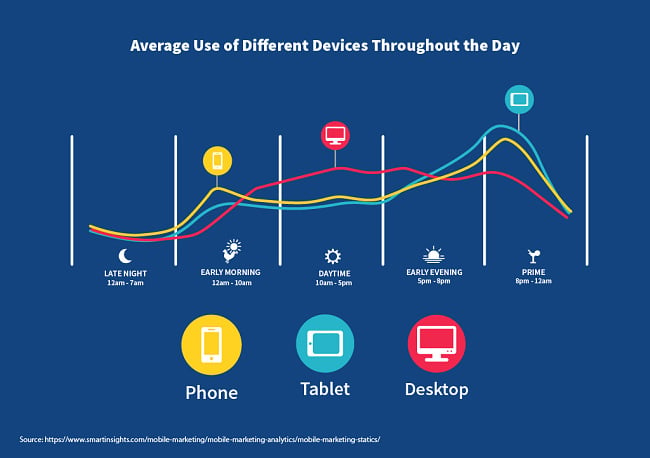
19. Desktop devices are used more often during the day between 10am and 5pm when workers are in their cubicles or offices, while mobile devices are more popular when people are off the clock at home, particularly after 8pm in the evening.
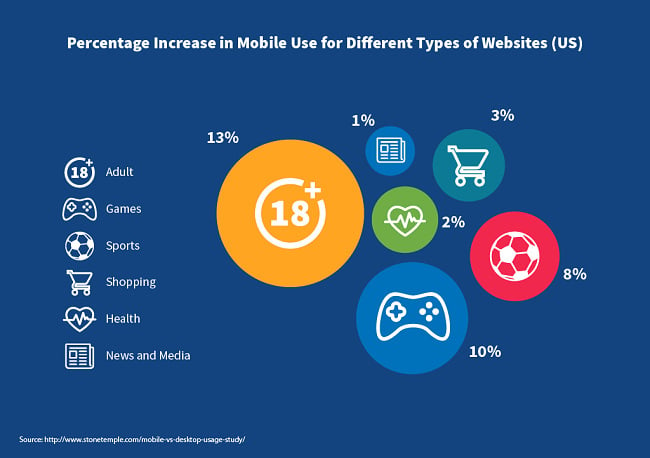
20. Certain types of websites – like those dedicated to adult content (13%) and gaming (10%) – are seeing a large increase in access from mobile devices, especially when compared to news and health sites, which only get a combined 3%.
This is likely due to advancements in mobile technology. In today’s context, mobile devices possess sufficient capabilities to support websites and platforms streaming video, a task that typically demanded higher processing power than what was previously within reach for phones.
21. Even in affluent regions, like Europe (15%) and North America (17%), there are still a fairly large number of people who do not access the internet on their phones.
Trends in Digital News
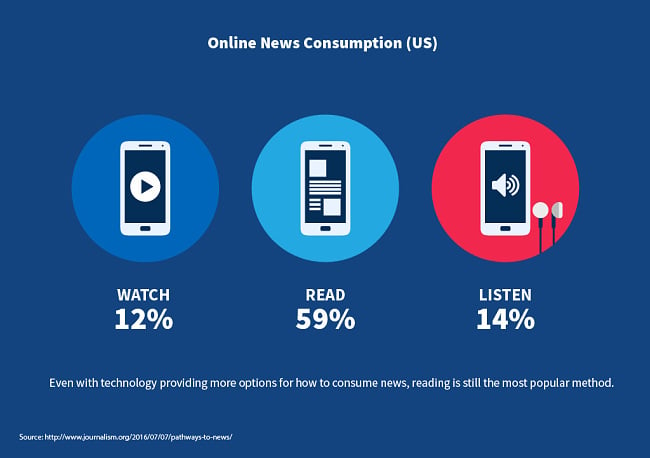
22. 59% of people still prefer to read the news online rather than listen to or watch it.
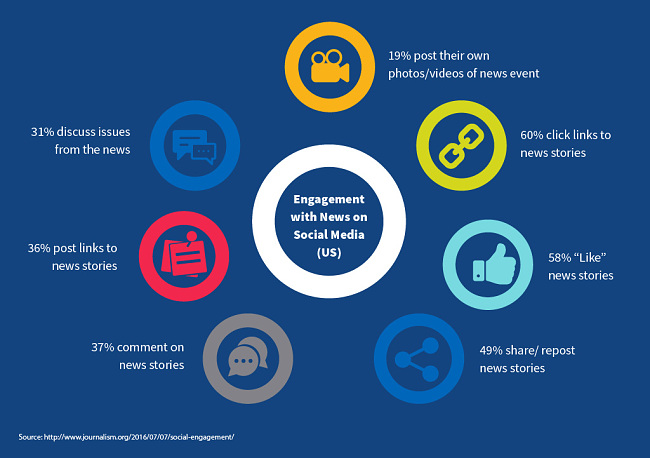
23. The most common ways for people to engage with the news on social media are the ones that require the least effort, such as clicking links (60%) or “liking” (58%). Engagement drops for more labor-intensive interactions, such as posting news stories (36%) or discussing current events (31%).
You’re welcome to use and share the images or data from this page, but please provide attribution.


Leave a Comment
Cancel