
Paessler PRTG Network Monitor Download for Free - 2024 Latest Version
| 22 | |
| Windows | |
| Free Trial | |
| Paessler AG | |
| 1,481,845 | |
| Business Tools |

The PRTG (Paessler Router Traffic Grapher) Network Monitor is an agentless infrastructure monitoring and management software. The system is designed to simplify the process of monitoring your entire network of computers and IoT devices, so you can know immediately if something is connected or running properly. The Paessler PRTG software helps improve network efficiency as it monitors the bandwidth and tracks how many resources are in use.
Paessler has on-premise and cloud-based PRTG options, and the plans vary based on the number of sensors, or metrics on each device, that you want to monitor.
Follow the instructions below, and I’ll show you how to download and install Paessler PRTG Network Monitor for free.
Download Paessler PRTG for Free!
How to Download and Install The Paessler PRTG Network Monitor on your PC for Free
- Go directly to the official Paessler website.
- Press the Free Trial button.
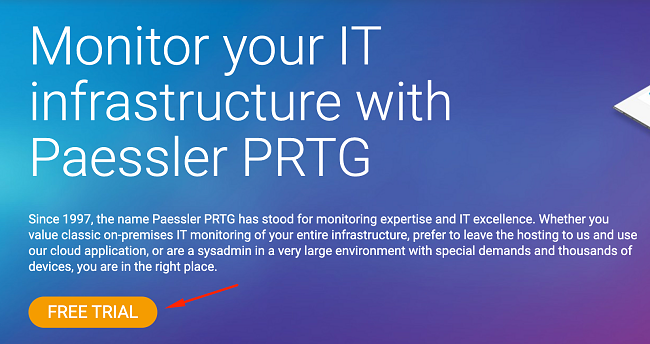
![PRTG FREE TRIAL]()
- Select a destination folder, and the PRTG Network Monitor installer file will automatically download to your computer.
- Open the file to run the setup wizard, and choose your preferred language.
- Accept the License Agreement and press Next.
- Enter an email address where you want Paessler to send network alerts, then press Next.
- Paessler gives you the option for an Express installation, or you can choose the Custom option, manually select the installation path, and configure the monitoring features. For this example, I’ll be using the Express option. When you press the next button, the software will install on your computer.
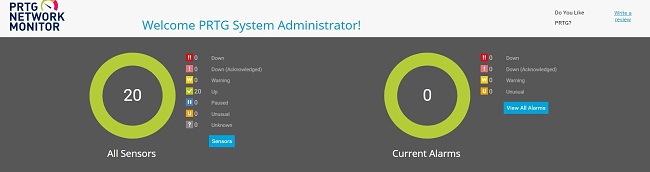
- When the installation is complete, PRTG will open in your default browser with a login page.
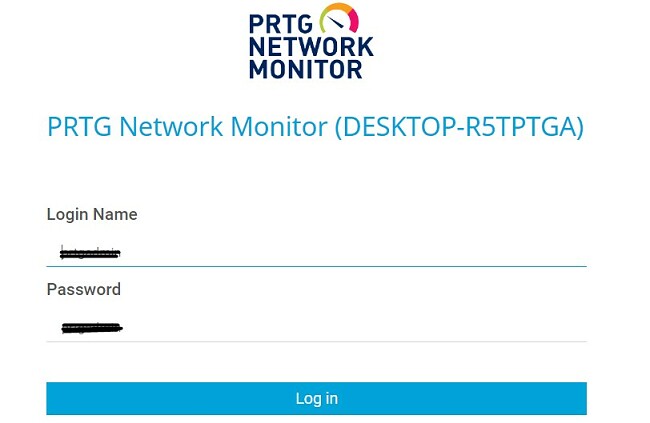
![PRTG login page]()
- The username and password will automatically appear on the login page. Once you log in the first time, your 30-day free trial will begin.
Paessler PRTG Network Monitor Overview
PRTG is a Windows-based network monitoring tool that collects data from all IoT devices on your network. This includes routers, servers, switches, smart TVs, and more. It gives IT teams instant notifications if there are problems on the network, so they can be fixed before the system crashes. This can help prevent costly outages that are not only expensive to repair but damages that can prevent your employees, clients, or customers from using your services.
PRTG is very easy to install and operate, which is one of the reasons it’s so popular among small and medium businesses. During the initial setup, it will automatically connect with all the IoT devices, and poll them through SNMP, WMI, packet sniffing, Net flow, jflow, sflow, or IPFIX. The browser-based interface is configured to allow real-time troubleshooting and generating non-technical reports that can be shared with the entire staff.
Paessler PRTG Network Monitor Features
The PRTG Network Monitor is an on-premise solution that has its core server and local probe run in your network. It monitors a large number of areas of the network, including:
- Uptime, downtime and slow servers
- Hardware devices and inspect their health
- Mobile and desktop applications
- Virtual machines and virtual servers
- Email and cloud servers
Manage Individual Sensors
Sensors are the different types of elements in each device that PRTG can monitor. This can be the network health stats, monitoring how much of the CPU is being used, or the port switch server. When setting up PRTG, you can turn on AutoDiscovery, which scans your network and lists all the possible Sensors. Once you activate a sensor, PRTG will track its behavior and send an alert if something isn’t working properly.
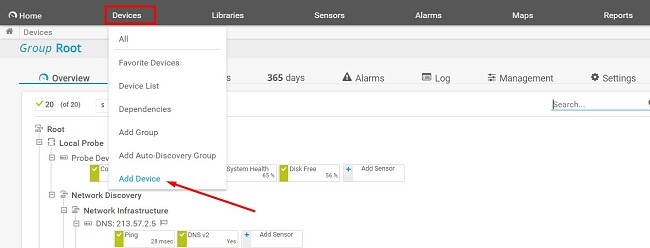
Manage Individual Devices
One of the PRTG top features is how it manages individual devices. Once the setup is complete, click on the Device tab on the top menu, and a sub-window will open. Choose the Add Device option, and a window will open. Enter the device IP address, select the device type, and choose whether you want the system to detect any relevant sensors to monitor.
Custom Alerts
You can set up triggers for alerts on each sensor or apply them to a parent group, which will also affect all the child groups.
There are different ways to trigger an alert notification. Some of the options are:
- Status alerts
- A server reaches a predefined limit
- CPU reaches a certain threshold
- Customize different conditions, and an alert will be sent when they are all met
Additionally, PRTG will automatically send an alert if one of your sensors is unresponsive or failing.
The default alert message is sent via email, if no action is taken, a secondary alert will be sent. You can choose whether that should be via SMS, Slack, Amazon Simple Notification System (SNS), HTTP requests, and more.
You can also see the alert in the dashboard.
If the second alert doesn’t receive a response, PRTG will send a third and final notification.
Multiple Interfaces
The PRTG interface can be accessed from multiple platforms. It works with AJAX web, Windows, and mobile apps for Android and iOS.
Through the AJAX Web interface, you can access comprehensive configurations and trees for various systems and servers. It stands out as the optimal choice for configuring your entire network while efficiently managing individual users. The Windows app is ideal for users who want to connect to the main server and view the reports, see the setup config, status monitoring, and network optimization.
The Android and iOS apps are mainly for viewing the monitoring data while you’re out of the office, although there are some configuration options.
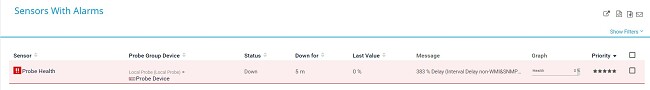
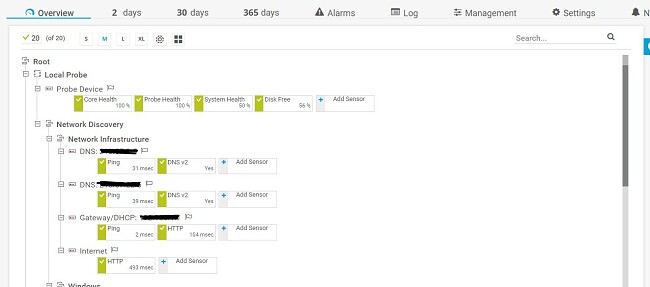
Graphic Dashboard Uses Real-Time Maps
The first thing I noticed looking at the dashboard was the graphic user interface. It has charts and graphs that are updated in real-time, making it easy to visualize the relevant data.
 The graph shows me all my current sensors, and what kinds of alerts were triggered
The maps show more than just the connected devices, sensors, and connections. You can also get in-depth information regarding the status of each connection.
There is the option to share the map with anyone. You can create a unique URL for each map and change the status to Public Access. Then, anyone with a link will be able to view the data.
Generate Detailed Reports
Create custom reports based on the numbers, stats, and charts for any network or device configuration. You can generate a report at any time or create aschedule and reports will be created on a daily, weekly and monthly basis. All reports can be exported as an XML, PDF, HTML, or CSV files.
Download PRTG Network Monitor for Free!
How to Uninstall Paessler PRTG From Your PC
If PRTG Network Monitor isn’t the right infrastructure monitoring software for your needs, it can be uninstalled in a few easy steps.
- Type Add or Remove Programs in the Windows search bar and press Enter.
- Locate PRTG Network Monitor and press Uninstall.
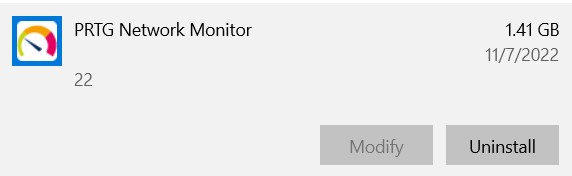
![Uninstall PRTG]()
- Confirm that you want to remove PRTG Network Monitor, and Windows will uninstall it from your PC.
FAQ
Is Paessler PRTG Network Monitor free?
The PRTG Network Monitor is a premium software, although there is a limited freeware version that works with up to 100 sensors. However, if you want to experience the full power of PRTG Network Monitor, try it free for 30 days and see how it works with your network.
Is Paessler PRTG Network Monitor secure?
The PRTG Network Monitor apps are encrypted to protect your data and network from hackers. Not only that, the software monitors your security tools, such as the firewall, VPN, Windows updates, open ports, and more. If the system detects a vulnerability, it will send an alert, so you can protect your network. Download PRTG Network Monitor and secure your network free for 30 days.
What does Paessler PRTG Monitor?
PRTG monitors all IoT devices on your network, including virtual machines. Each connection can have multiple sensors, which is the aspect of the device that’s being monitored. Most devices have an average of 5 to 10 sensors, these can be a specific URL traffic on a network connection, a specific port of a switch, or the resources used by the device. All the data is uploaded to the dashboard, where you can create reports and examine the data to ensure that your entire network is running smoothly.